new site, new address: www.quanttrader.ddns.net
Trading strategies, technical analysis and speculations.
Download trading related, strategies, indicators.
Author: Philipp Kahler
Blog moved
Sorry, bu this has never been intended to be a code base for masses of people.
Therefore I moved the page to my private webserver, running on my raspberrypi.
Visit my new trading blog at http://quanttrader.ddns.net/wordpress/
The patient ones will get a connection…
take care,
take profits,
philipp
Stop – Entry bar HiLo time stop
This stop protects your position against scenarios where nothing happens.
Usually you would assume to be in a winning position after a few bars. Therefore this stop script is activated a few bars after the entry. Then it is set to the low (for long) or high (for short) of the entry bar.
Be aware that even if you set the time delay parameter to 0, there will be no stop generated on the entry bar. Use the % stop or cash stop additionally.
Meta: Synopsis("Sets stop to Hi/Lo of entry bar after x bars.");

Inputs: EntrypriceStopBars(5), visuals(true);
if barssinceentry>=EntryPriceStopBars then begin
if marketposition=1 then sell next bar at low[barssinceentry] stop;
if marketposition=-1 then cover next bar at high[barssinceentry] stop;
end;
if visuals=true then drawsymbol(getactiveorderprice(1));
Save script as strategy
Position Sizing – constant cash
This script invests the same ammount of money with every trade. This is especially useful when backtesting a strategy. If you would always trade 1 contract, the absolute level of the market would impact your backtest results.
Investing the same ammont of money automatically overcomes this effect. To avoid rounding errors select the amount to be invested 100*Maximum of market in backtest.
This script overrides the tradesignal money management setting defining the standard size to be traded. If your strategy says how may shares to buy or sell, this script will not override your strategy.
Meta: Synopsis("Invests the same amount of money in every trade");

Inputs: invest(100000);

Variables: con;
con=round(invest/close,0);
SetDefaultQuantity(maxlist(1,con));
Save code as strategy
Stop – Profit Trailing
This Stop locks in your profits – if the market moves in your direction, your stop does too.
Example:
1.You enter at 100, stop 10%
Initial Stop will be 90. (=100-10% of 100)
2.The market moves to 95
Stop stays at 90 (no new high)
3. The market moves to 110
Stop is raised to 99.9 (100-10% of 110)
4. The market falls back to 105
Stop stays at 99.9 (no new high)
5. The market moves to 120
Top is raised to 118 (120-10% of 120)
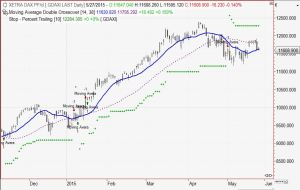
or have a look at the chart:
Meta: Synopsis("Protekts Profits. Stop is set % under last trade equity high");

Inputs: PercentTrailing(10.0), visuals(true), StopOnEntryBar(false);

Variables: hh, ll;
If barssinceentry>=0 then begin
hh=highest(high,maxlist(1,barssinceentry+1));
ll=lowest(low,maxlist(1,barssinceentry+1));
if marketposition=1 then sell next bar at hh-percentTrailing*hh/100 stop;
if marketposition=-1 then cover next bar at ll+percentTrailing*ll/100 stop;
end;
setstopcontract;
If StopOnEntryBar then setstoploss(close/100*percenttrailing); // close used, as entryprice is not available at first bar
if visuals=true then drawsymbol(getactiveorderprice(1));
Save code as strategy
Stop – Percent
This stop defines the maximum % the market is allowed to move against you before the position is closed.
At the entry bar the previous days close is used as an asumption for the entryprice (not available on entrybar)
For all following bars the exact entryprice is used for the stop calculation.
For a hard coded cash stop see Stop – Cash article.
Meta: Synopsis("Sets % Stop Loss");

Inputs: Visuals(true),percentStop(10.0);

Variables: price;
if marketposition=0 then price=close else price=entryprice;
setstopcontract;
setstoploss(price*percentStop/100);
if visuals then drawsymbol(getactiveorderprice(1));
Save code as strategy
Stop – Cash
This is just a simple cash stop. It sets the maximum amount of money you are willing to lose with the current position.
It works in realtime, stop becomes active at the same time the position is established (no 1 bar delay)
If you want to use a % stop, see Stop – Percent article.
Meta: Synopsis("Sets cash stop for total position");

Inputs: Visuals(true), CashStop(1000);
setstoploss(cashstop);
if visuals then drawsymbol(getactiveorderprice(1));
Save code as strategy
Bollinger bands – multiple timeframe indicator
Clustering of signals can lead to some nice high probability trades.
clustering: when signals on different timeframes show the same; thus all traders, regardless if they trade daily or intraday, have got the same setup on their charts.
To make use of clustering signals you must have a multiple timeframe indicator that shows you what the traders on different timeframes can see right now.
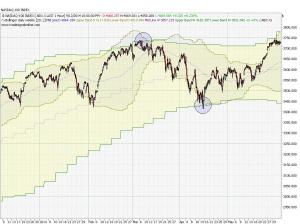
Therefore I added a second timeframe to the Bollinger band. This multiple timeframe indicator wills how you the daily and weekly Bollinger band, even when applied on an intraday chart!
daily chart showing daily and weekly Bollinger. note the clustering when daily and weekly Bollinger bands overlap:
hourly chart showing daily and weekly Bollinger:
indicator code:
Meta:SubChart( False );

Inputs: Period( 20 ), StdDevs( 2.0 );
Variables:
avg, lowerBand, upperBand,avg2, lowerBand2, upperBand2;
BollingerBands( close of 'data1 d', Period, StdDevs, avg, upperBand, lowerBand );
BollingerBands( close of 'data1 w', Period, StdDevs, avg2, upperBand2, lowerBand2 );
DrawLine( avg, "Mid Line D", StyleDot );
DrawArea( upperBand, lowerBand, "Upper Band D", "Lower Band D" );
DrawLine( avg2, "Mid Line W", StyleDot );
DrawArea( upperBand2, lowerBand2, "Upper Band W", "Lower Band W" );
day range vola band
Observing the daily movements from open to close can give you a nice impression on intraday support & resistance and possible break out points. Therefore you can use the day range indicator for trend trading (breakouts) and intraday targets (support/resistance). The basic version is pre-defined in the tradesignal terminal software.
I added a volatility band around this indicator to make it more useful for trading.
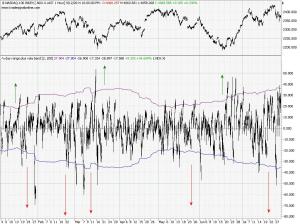
The first screenshot shows you what this indicator is all about: it basically just displays the daily movement starting at zero. Thus the indicator only displays the intraday movement, without any information on the absolute level of the market or the longer term trend. The band around the indicator is a 2 standard deviation band over the last 200 candles (customize on properties page of indicator)
There are 3 possible scenarios you might use this indicator for; see screenshot for details:
A (and B): This is the normal scenario, on a normal day when nothing special happens. The market usually will touch the band (B) or penetrate it a little bit and then come back (A). Thus this indicator can be used to get an estimation for some kind of intraday profit target.
C: That`s one of the days when this indicator gives the best signals. A Crazy Day! If the market does not reverse around the band (A&B) you can bet on a nice movement until the closing bell. Have a look at screenshot 2 to get a glimpse on what can happen on such days:
The touch of the band is also an interesting point for option strategies. In this case the upper and lower bands represent some kind of action point where you might want to revisit your hedging of the position…
The indicator code:
Inputs: dev(2.0),period(200);

Variables:oo( Invalid ),colour;
colour=black;
If Date Date[1] Then oo = Open;
drawline(0+dev*stdev(Close - oo,period));
drawline(0-dev*stdev(Close - oo,period));
if close-oo>dev*stdev(Close - oo,period) then colour=darkgreen;
if close-oo<-1*dev*stdev(Close - oo,period) then colour=red;
DrawBar( Open - oo, High - oo, Low - oo, Close - oo,colour,colour);
Drawline( 0, "Zero Line" );
Corona Charts
John Ehlers did a fabulous thing when he created his corona charts. Not only is it the most colourful indicator in technical analysis, it also, especially the dominant cycle length, is quite a useful cycle analysis tool.
Get the full John Ehlers article from this obscure russian ftp site:
ftp://80.240.216.180/Transmission/%D0%A4%D0%B0%D0%B9%D0%BB%D1%8B/S&C%20on%20DVD%2011.26/VOLUMES/V26/C11/200EHLE.pdf
I did a tradesignal version of this indicator, download the workspace and save it as template.
download tradesignal workspace


