Bollinger bands – multiple timeframe indicator

Clustering of signals can lead to some nice high probability trades.

clustering: when signals on different timeframes show the same; thus all traders, regardless if they trade daily or intraday, have got the same setup on their charts.


To make use of clustering signals you must have a multiple timeframe indicator that shows you what the traders on different timeframes can see right now.

Therefore I added a second timeframe to the Bollinger band. This multiple timeframe indicator wills how you the daily and weekly Bollinger band, even when applied on an intraday chart!

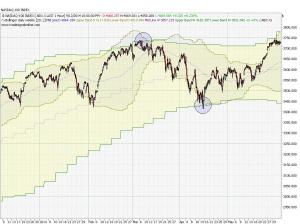
daily chart showing daily and weekly Bollinger. note the clustering when daily and weekly Bollinger bands overlap:

bollinger band daily and weekly2


hourly chart showing daily and weekly Bollinger:

bollinger band daily and weekly


indicator code:

Meta:SubChart( False );
Inputs: Period( 20 ), StdDevs( 2.0 );

Variables:
avg, lowerBand, upperBand,avg2, lowerBand2, upperBand2;

BollingerBands( close of 'data1 d', Period, StdDevs, avg, upperBand, lowerBand );
BollingerBands( close of 'data1 w', Period, StdDevs, avg2, upperBand2, lowerBand2 );

DrawLine( avg, "Mid Line D", StyleDot );
DrawArea( upperBand, lowerBand, "Upper Band D", "Lower Band D" );
DrawLine( avg2, "Mid Line W", StyleDot );
DrawArea( upperBand2, lowerBand2, "Upper Band W", "Lower Band W" );

day range vola band

Observing the daily movements from open to close can give you a nice impression on intraday support & resistance and possible break out points. Therefore you can use the day range indicator for trend trading (breakouts) and intraday targets (support/resistance). The basic version is  pre-defined in the tradesignal terminal software.

I added a volatility band around this indicator to make it more useful for trading.


day range plus vola band


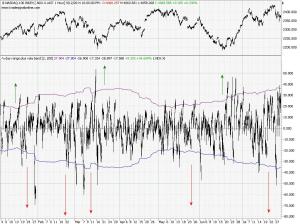
The first screenshot shows you what this indicator is all about: it basically just displays the daily movement starting at zero. Thus the indicator only displays the intraday movement, without any information on the absolute level of the market or the longer term trend. The band around the indicator is a 2 standard deviation band over the last 200 candles (customize on properties page of indicator)

There are 3 possible scenarios you might use this indicator for; see screenshot for details:

A (and B): This is the normal scenario, on a normal day when nothing special happens. The market usually will touch the band (B) or penetrate it a little bit and then come back (A). Thus this indicator can be used to get an estimation for some kind of intraday profit target.

C: That`s one of the days when this indicator gives the best signals. A Crazy Day! If the market does not reverse around the band (A&B) you can bet on a nice movement until the closing bell. Have a look at screenshot 2 to get a glimpse on what can happen on such days:

day range plus vola band2

The touch of the band is also an interesting point for option strategies. In this case the upper and lower bands represent some kind of action point where you might want to revisit your hedging of the position…


The indicator code:

Inputs: dev(2.0),period(200);
Variables:oo( Invalid ),colour;

colour=black;
If Date Date[1] Then oo = Open;
drawline(0+dev*stdev(Close - oo,period));
drawline(0-dev*stdev(Close - oo,period));
if close-oo>dev*stdev(Close - oo,period) then colour=darkgreen;
if close-oo<-1*dev*stdev(Close - oo,period) then colour=red;

DrawBar( Open - oo, High - oo, Low - oo, Close - oo,colour,colour);
Drawline( 0, "Zero Line" );

Corona Charts

John Ehlers did a fabulous thing when he created his corona charts. Not only is it the most colourful indicator in technical analysis, it also, especially the dominant cycle length, is quite a useful cycle analysis tool.

Get the full John Ehlers article from this obscure russian ftp site:

ftp://80.240.216.180/Transmission/%D0%A4%D0%B0%D0%B9%D0%BB%D1%8B/S&C%20on%20DVD%2011.26/VOLUMES/V26/C11/200EHLE.pdf

I did a tradesignal version of this indicator, download the workspace and save it as template.


corona charts


download tradesignal workspace


Ignore inside candles

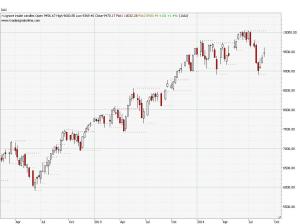
When detecting local highs and lows inside candles must be ignored. They contain no new information and only confuse the algorithm that detects the swing levels.

definition of swing high: a high that has got a lower high on the left and right side (reverse for swing low)

So if this “high on the left and right side” is an inside bar, the swing high will most probably not be a significant one.

This code first removes the inside bars. Then the swing point detection is applied afterwards. You get a nice chart with no inside bars and the significant highs and lows for emnty&exit

Variables:oo,cc, hh(invalid),ll,hh1,hh2,ll1,ll2, sh, sl;

if hh=invalid then begin
hh=h;
cc=c;
ll=l;
oo=o;
end;

if h crosses above hh
or l crosses below ll then begin
hh2=hh1;
ll2=ll1;
hh1=hh;
ll1=ll;
hh=h;
cc=c;
ll=l;
oo=o;

if ll>ll1 and ll1<ll2 then sl=ll1;
if hh<hh1 and hh1>hh2 then sh=hh1;
end;

if hh<>hh[1] then drawcandlestick(oo,hh,ll,cc);

drawsymbol(sh);
drawsymbol(sl);

 
ignore inside candles